6.6 Describing a histogram
Things to note in your description of a histogram:
- Is it roughly symmetric or is it negatively or positively skewed?
- Is it roughly bell-shaped?
- Outliers - are there observations (bars) showing up far from the others?
- Are there multiple modes?
So, let’s look again at the penguin body mass histogram, and provide a description thereafter:
ggplot(data = penguins, aes(x = body_mass_g)) +
  geom_histogram(binwidth = 500, colour = "black", fill = "lightgrey") +
  xlab("Body mass (g)") +
  ylab("Frequency") +
  theme_bw()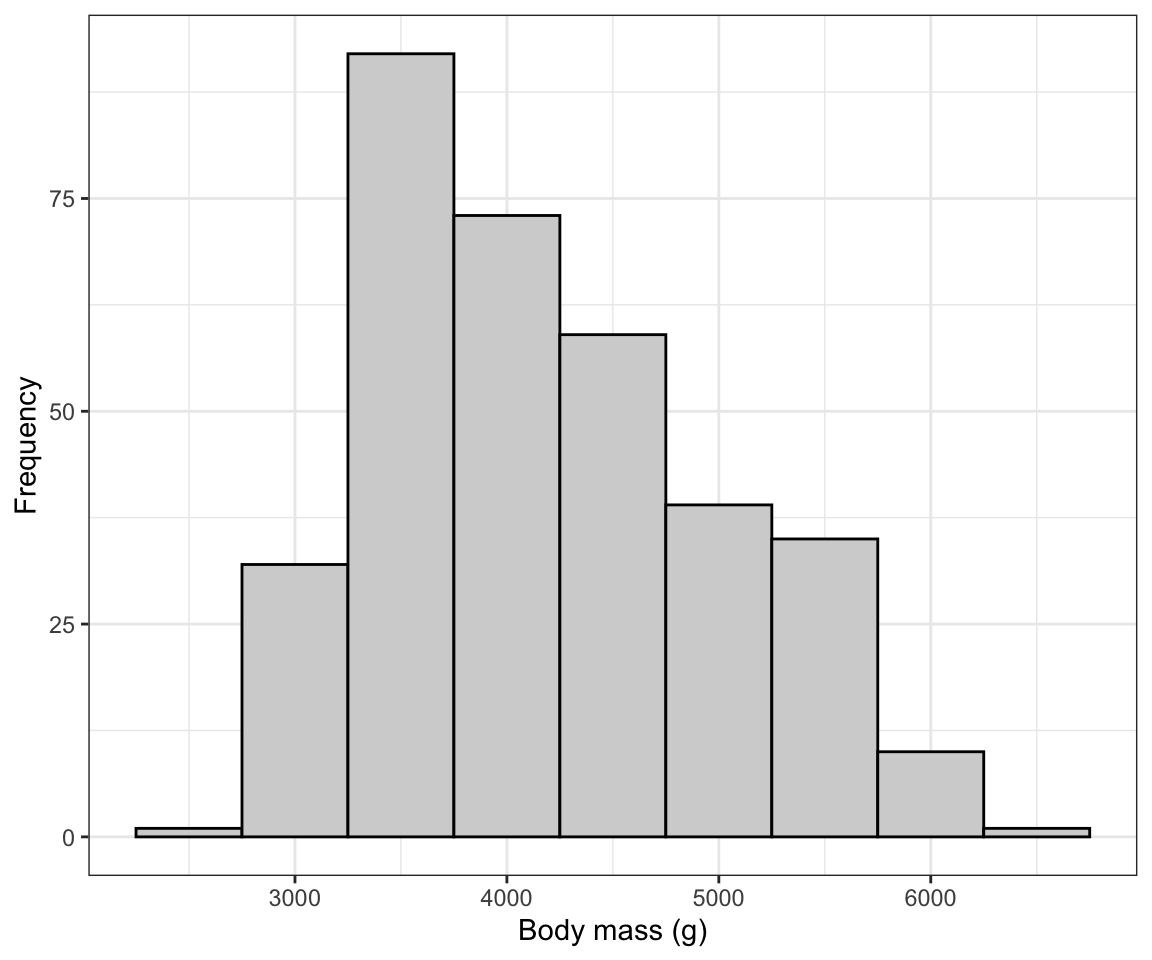
Figure 6.5: Histogram of body mass (g) for 342 penguins
The histogram is moderately positively skewed and thus asymmetric, with a single mode near 3500g. There are no obvious outliers in the distribution.
- Histogram: Create a histogram of the bill lengths of penguins in the
penguinsdataset, and include an appropriate figure caption. Then provide a description of what you see.