4.5 Setting up R Markdown for graphing
There are some special code chunk header arguments that need to be set in your Markdown document in order to:
- include proper Figure captions with your figures (a necessity!)
- set the dimensions of your figures
In each code chunk that includes code to construct a graph, your chunk header options should look like this in the top of the chunk, and there should be one blank line underneath before the main code starts. The following chunk produced the figure below. And recall that in the example below, the “bill_fig” text is simply the name I’ve given to this code chunk.
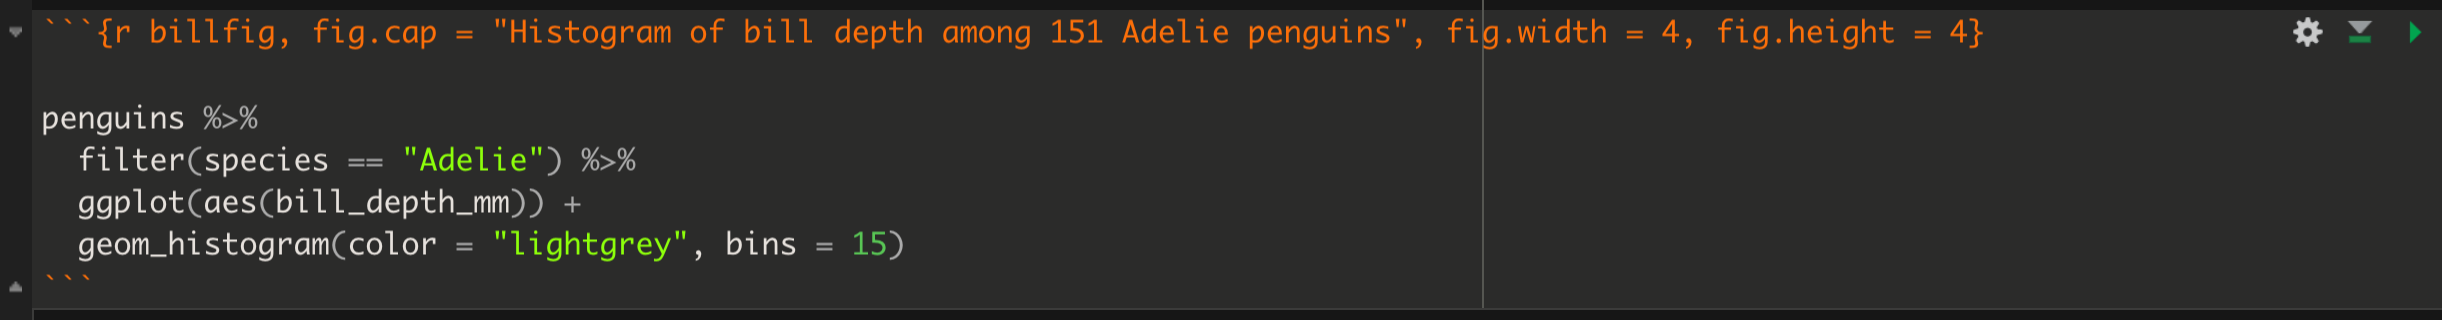
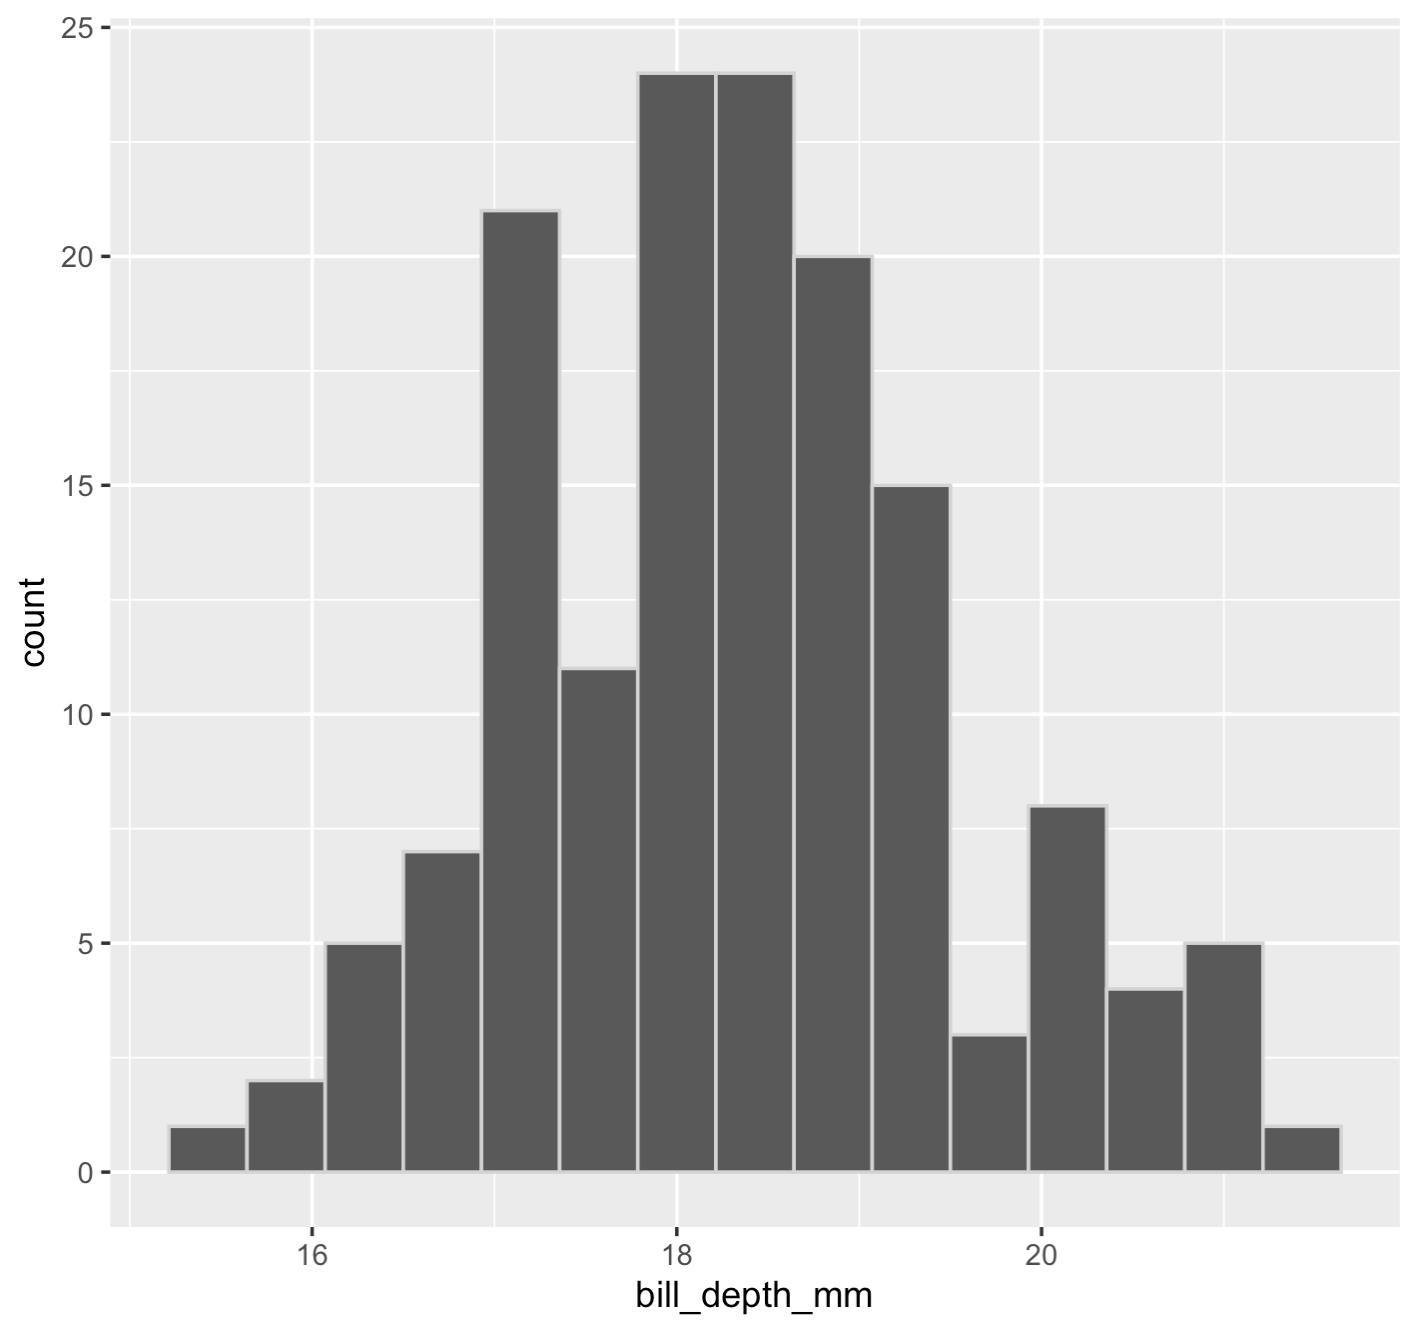
Figure 1: Histogram of bill depth among 151 Adelie penguins
The key parts are the “fig.cap =” argument, to which you provide the text you want to use as the figure caption. Then there’s the “fig.width =” and “fig.height =” arguments, which indicate the size of the figure when knitted. This will likely require some trial-and-error to get a good size, but start with the values in this example (4 for each).
Automated figure numbering
When you knit the document to PDF, you’ll see the “Figure X:” (with a number in place of the “X”) text was appended at the beginning of the caption phrase that was included in the chunk header, “Histogram of bill depth among 151 Adelie penguins”.
This feature - automatic figure numbering - was set within the header of the assignment markdown document:
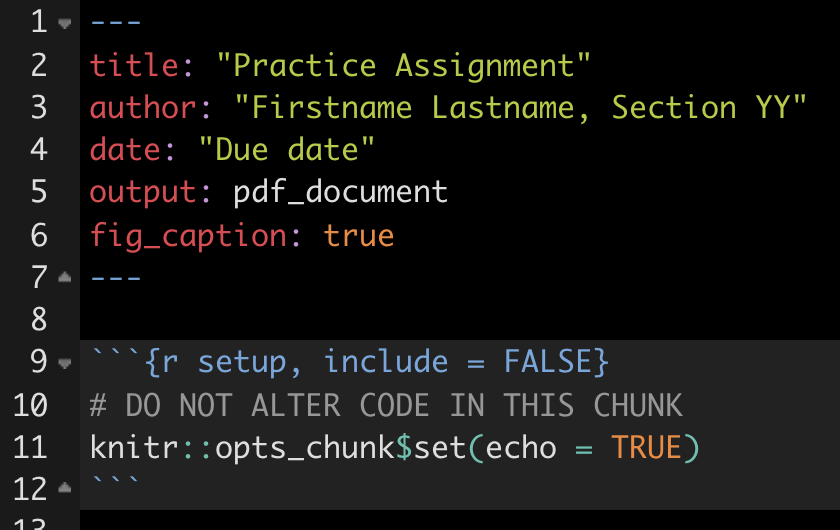
Figure 4.3: Assignment markdown file header with figure caption option
The line “fig_caption = true” tells R Markdown and the knitting process to automatically include this part of a figure caption, “Figure X”, underneath each figure you produce. Where “X” will automatically be replaced with the appropriate number. For example, it will use “Figure 1:” for your first figure, “Figure 2” for your second, and so on.
The figure captions will only appear correctly once you knit to PDF; captions do not appear in the preview provided within the editor pane.