5.1 Tidy data
Review the Biology Procedures and Guidelines document chapter on Tidy data.
There you’ll learn how to arrange and format your data within a spreadsheet. The “Tidy” example provided would look like this in Excel:
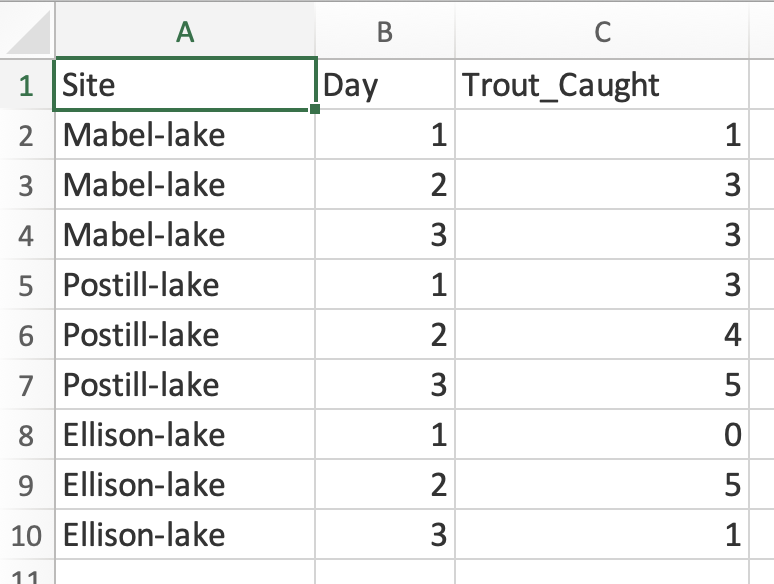
Figure 5.1: Tidy data in Excel
If you’d like a longer, more in-depth read about “tidy data”, see Hadley Wickham’s “R for Datascience” online book, linked here.
If you wish to import and analyze data that have not been formatted according to tidy principles, then the most transparent and computationally reproducible way to reformat the data is to do so by coding within R, rather than using software like Excel. The process of reformatting / rearranging data is called data wrangling, and is mostly beyond the scope of this course.
If you’re curious about data wrangling, the dplyr package, which is loaded with the tidyverse package, provides all the tools for data wrangling. Its associated cheatsheet is available at the package’s vignette website.