16.3 Size, shape & colour
Aesthetics such as size, shape, colour, and opacity are powerful ways of visually highlighting aspects of our data. These aesthetics can be mapped to individual variables, which is a great way to increase the number of dimensions–variables–we can plot. They can also be mapped to all data points. When used to map to a variable, we include this within the aes() argument. When used to map to all data points associated with a particular geom, we include this within the geom_plotType() argument.
Options include:
- size
- colour
- fill
- shape
- alpha
Things like bars have both colour (the outside line) and fill (the inside body) properties. Things like lines and points have colour, but not fill.
Plotting bill length against bill depth:
ggplot(data = penguins, aes(x = bill_length_mm, y = bill_depth_mm)) +
  geom_point()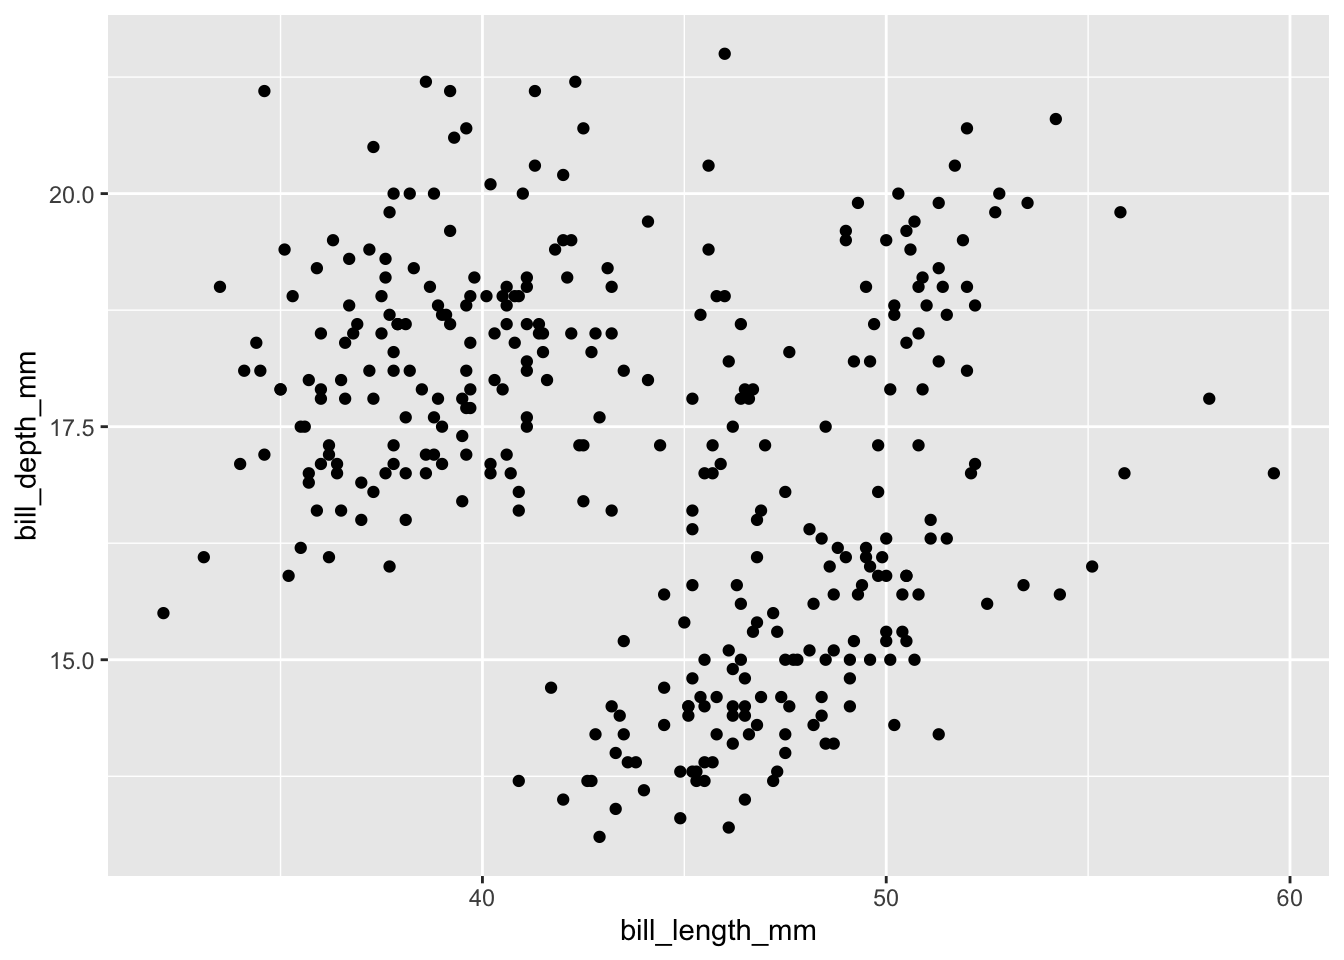
Adjusting the aesthetics of all data points
ggplot(data = penguins, aes(x = bill_length_mm, y = bill_depth_mm)) +
  geom_point(colour = 'red', size = 5, shape = 4)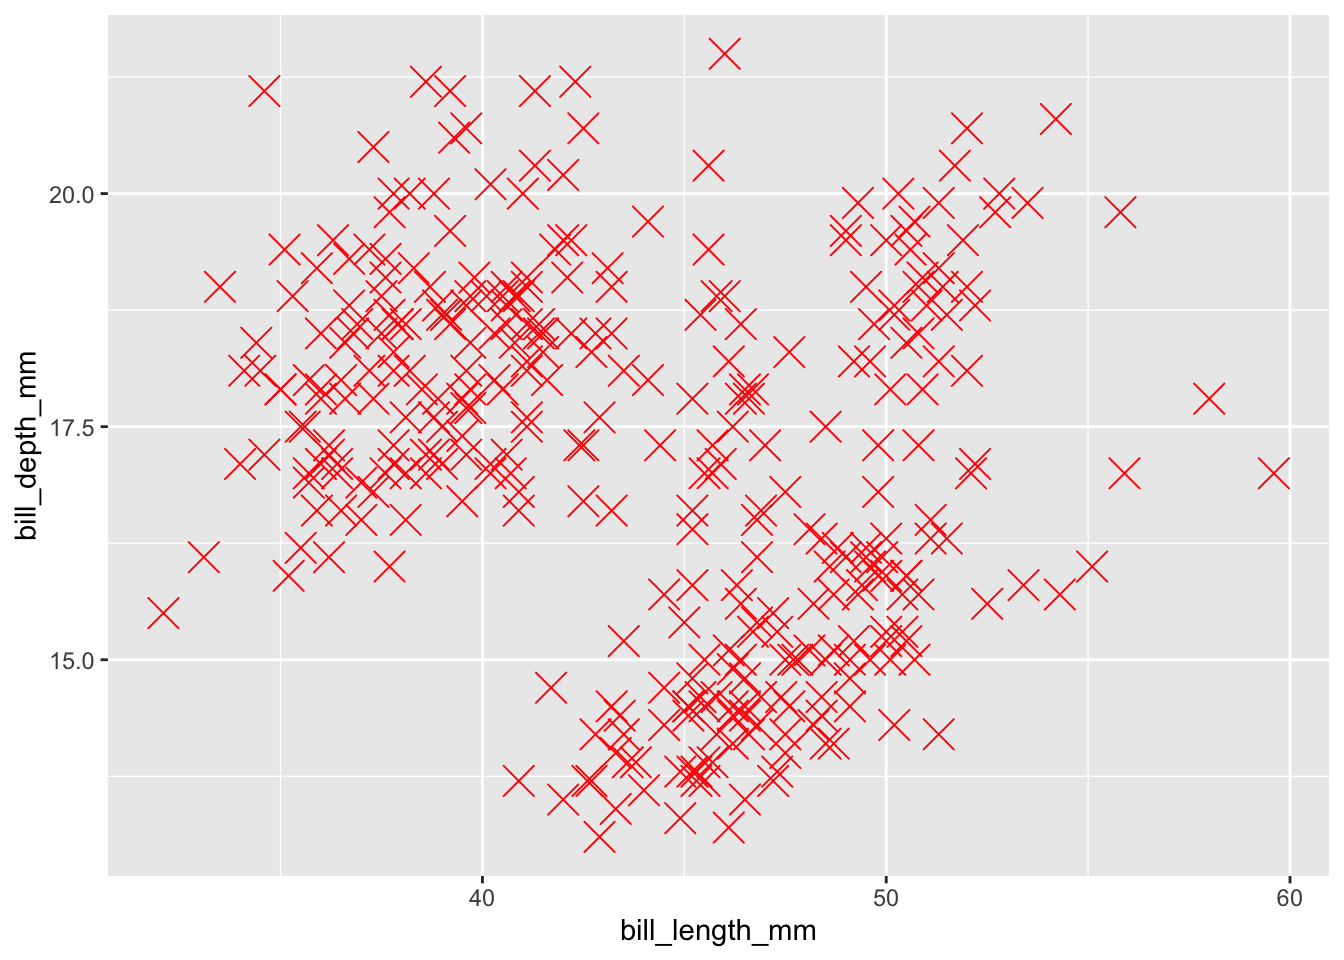
Increasing the number of variables we’re plotting:
ggplot(data = penguins, aes(x = bill_length_mm, y = bill_depth_mm, colour = island, shape = sex)) +
  geom_point()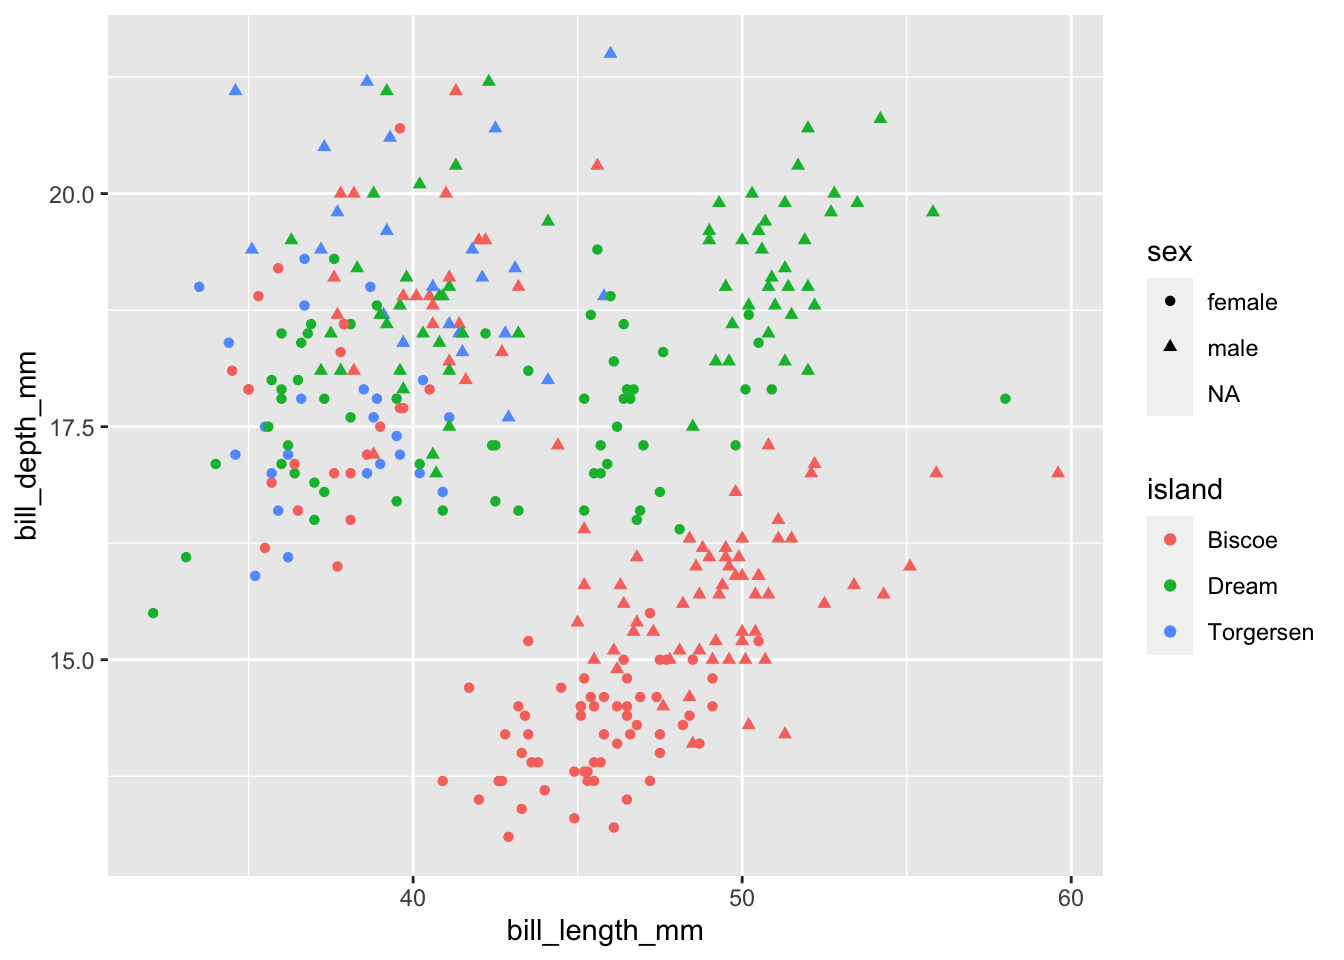
Adding more dimensions does not always increase the clarity of your graph, as the above example demonstrates!
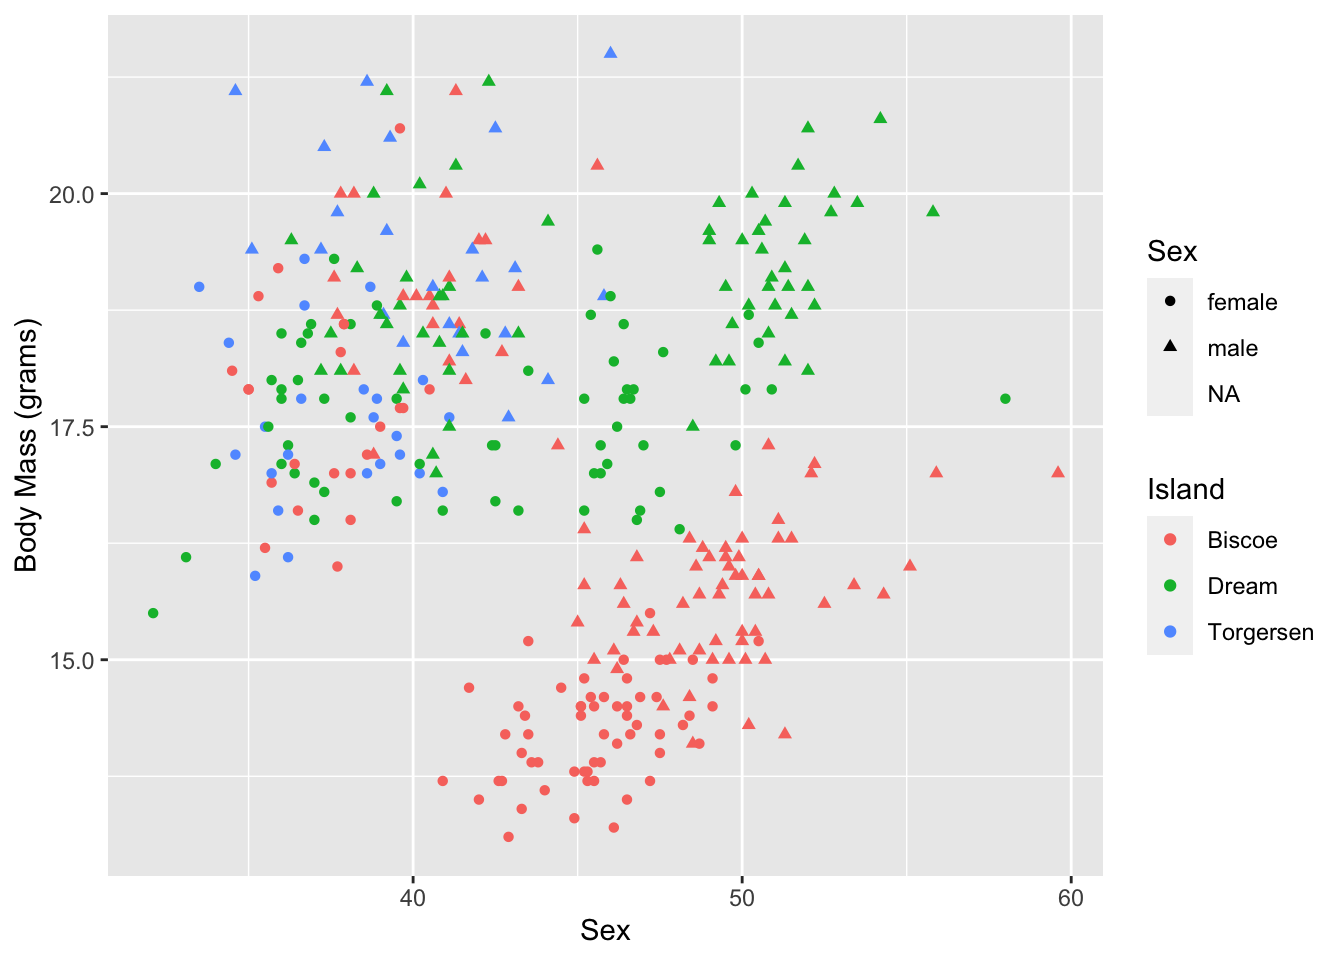
And with some proper labeling:
ggplot(data = penguins, aes(x = bill_length_mm, y = bill_depth_mm, colour = island, shape = sex)) +
  geom_point() +
  labs(
    x = "Sex",
    y = "Body Mass (grams)",
    colour = "Island",
    shape = "Sex"
  )