16.6 Faceting a Plot
We can also facet a plot with a call to facet_grid().
dotPlot +
  facet_grid(cols = vars(sex))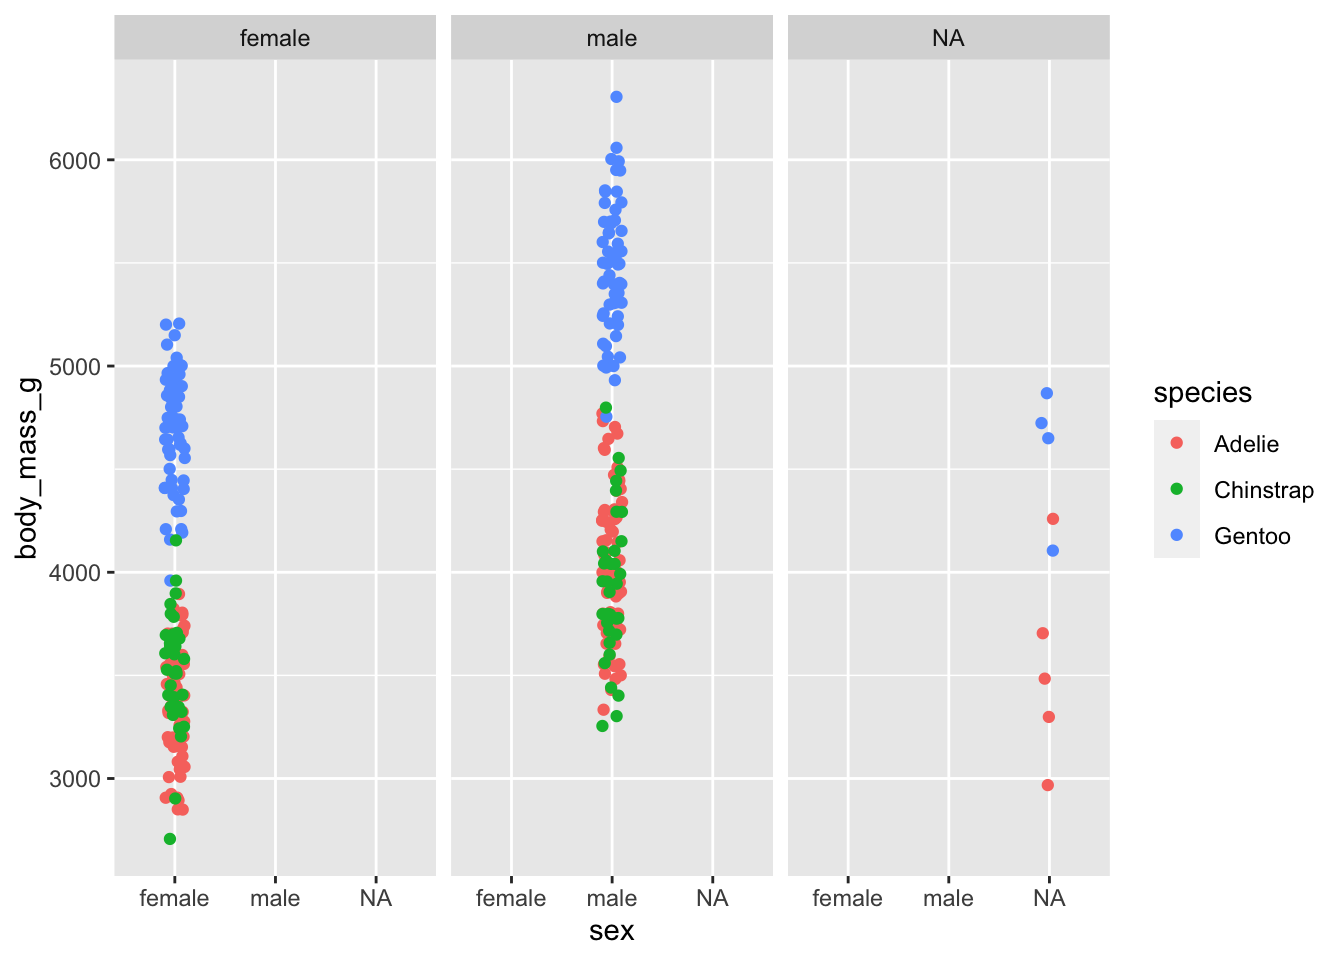
dotPlot +
  facet_grid(rows = vars(sex))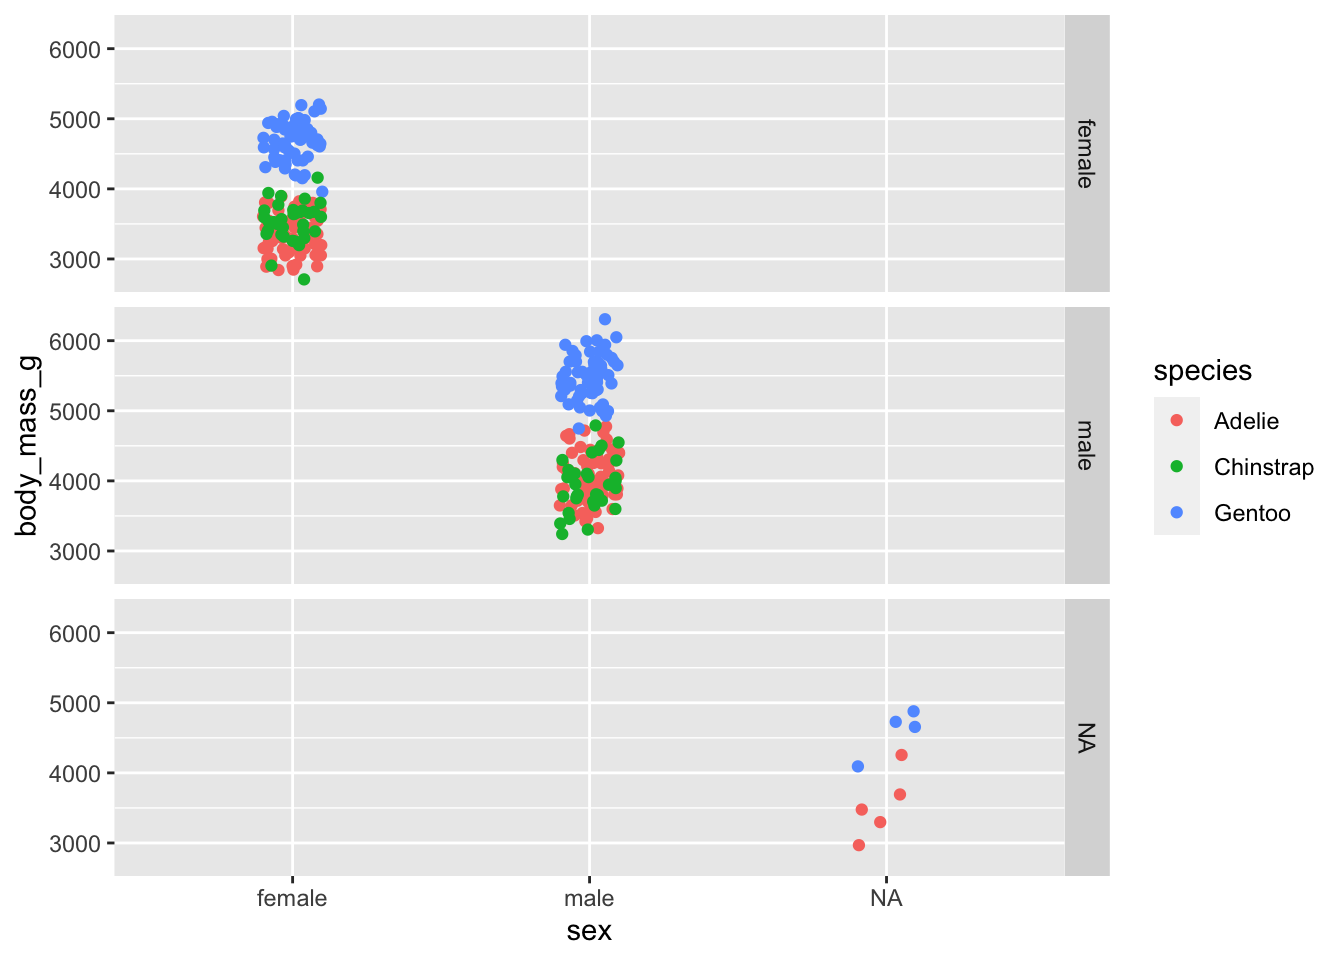
dotPlot +
  facet_grid(cols = vars(sex), rows = vars(island))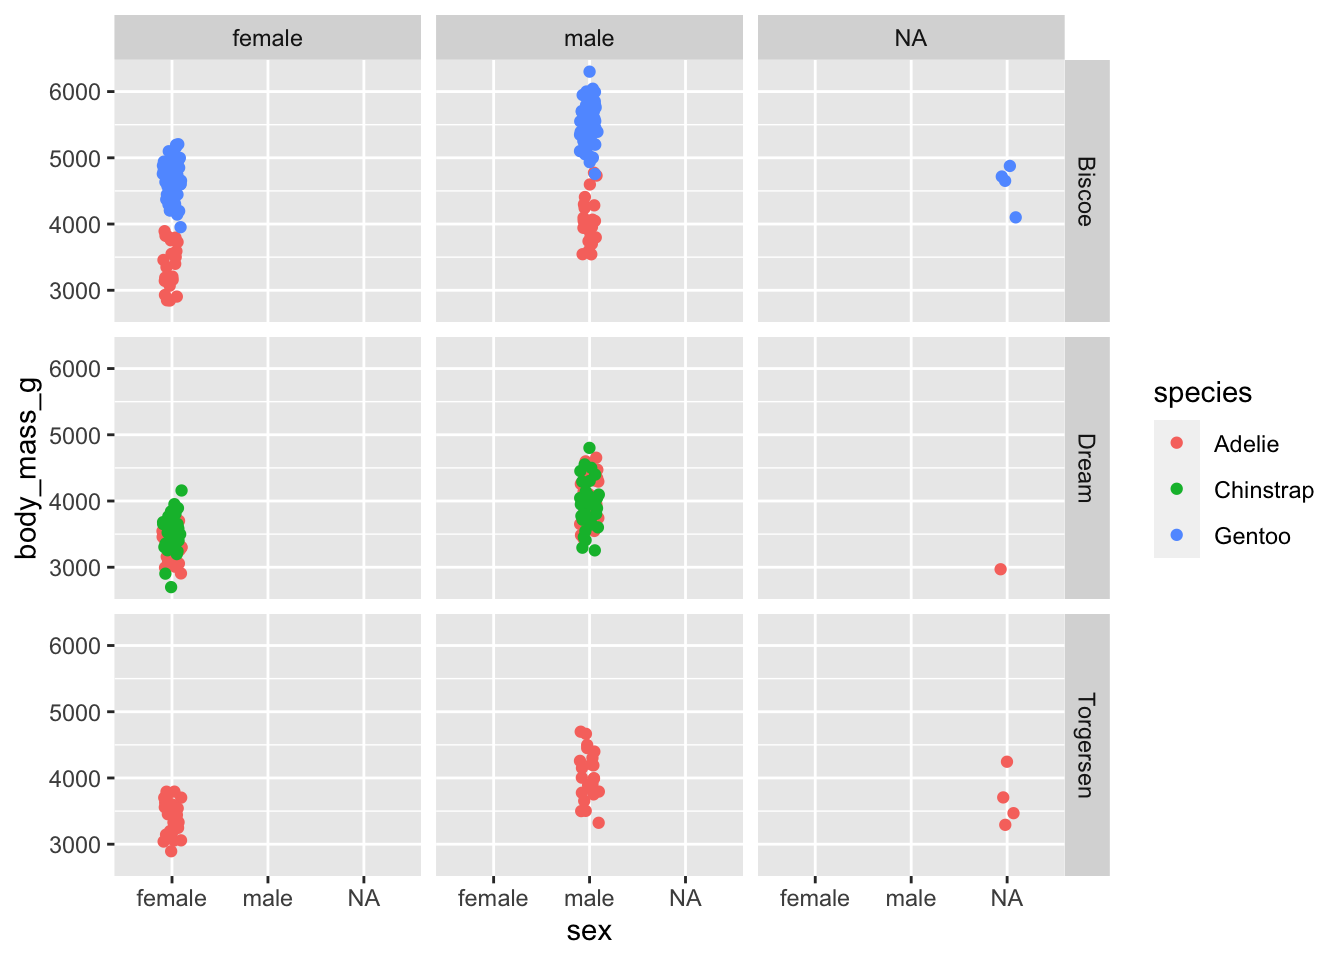
A slightly different notation is also valid to express the above graph
dotPlot +
  facet_grid(island ~ sex)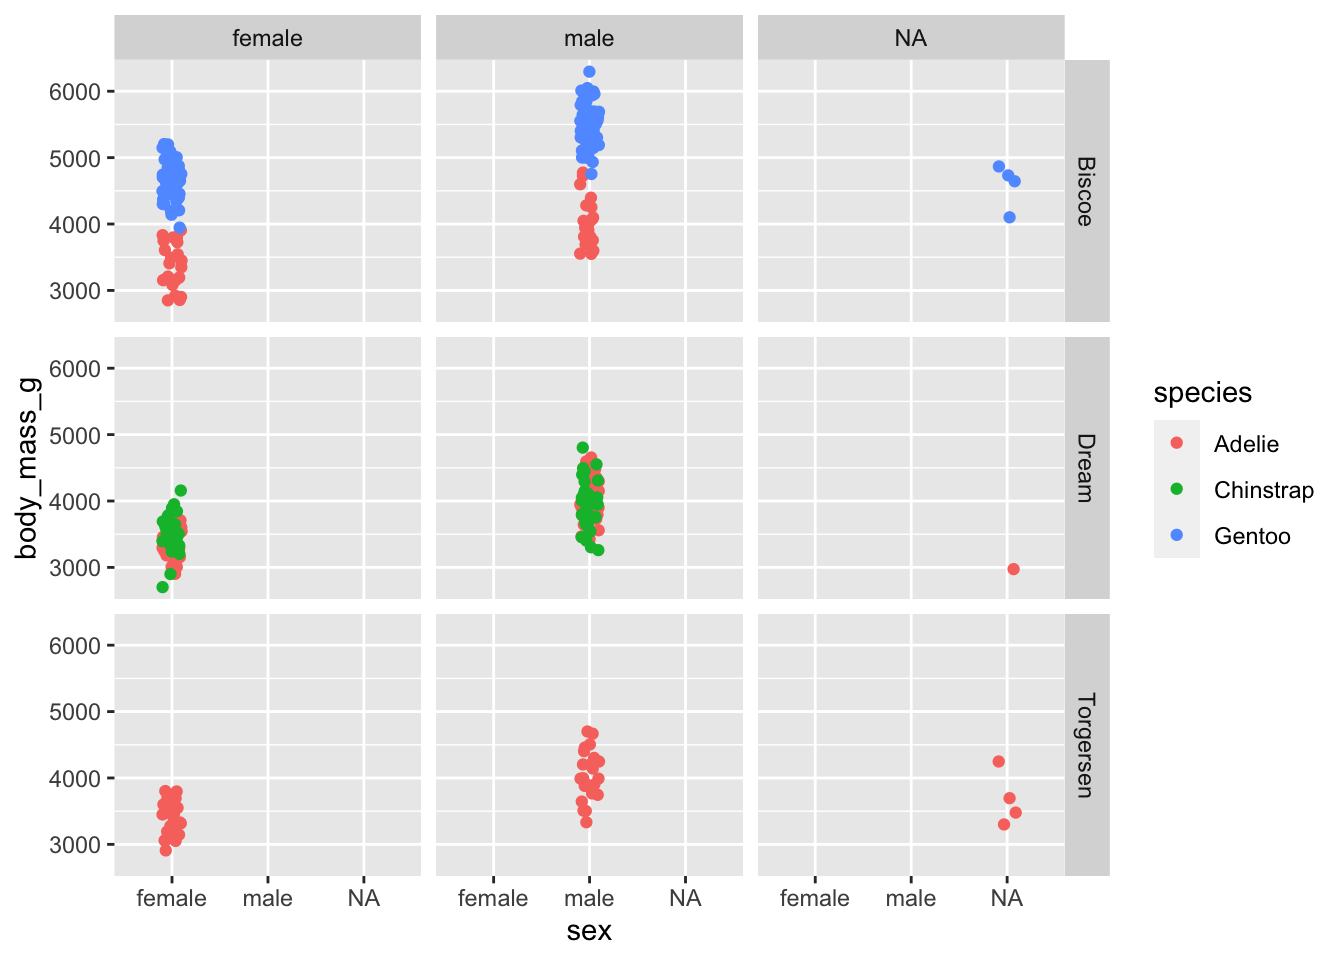
See additional facet options on the ggplot facet_grid() reference page.