16.5 More than one plot
There are several ways to place more than one plot side by side. One of the easiest is to use patchwork.
Install
install.packages("patchwork")Load
library(patchwork)This time we store our plots as variables
barGraph <- ggplot(data = penguins, aes(x = sex, fill = island)) +
  geom_bar()

dotPlot <- ggplot(data = penguins, aes(x = sex, y = body_mass_g, colour = species)) +
  geom_jitter(width = 0.1)
Then patchwork will arrange them
barGraph + dotPlot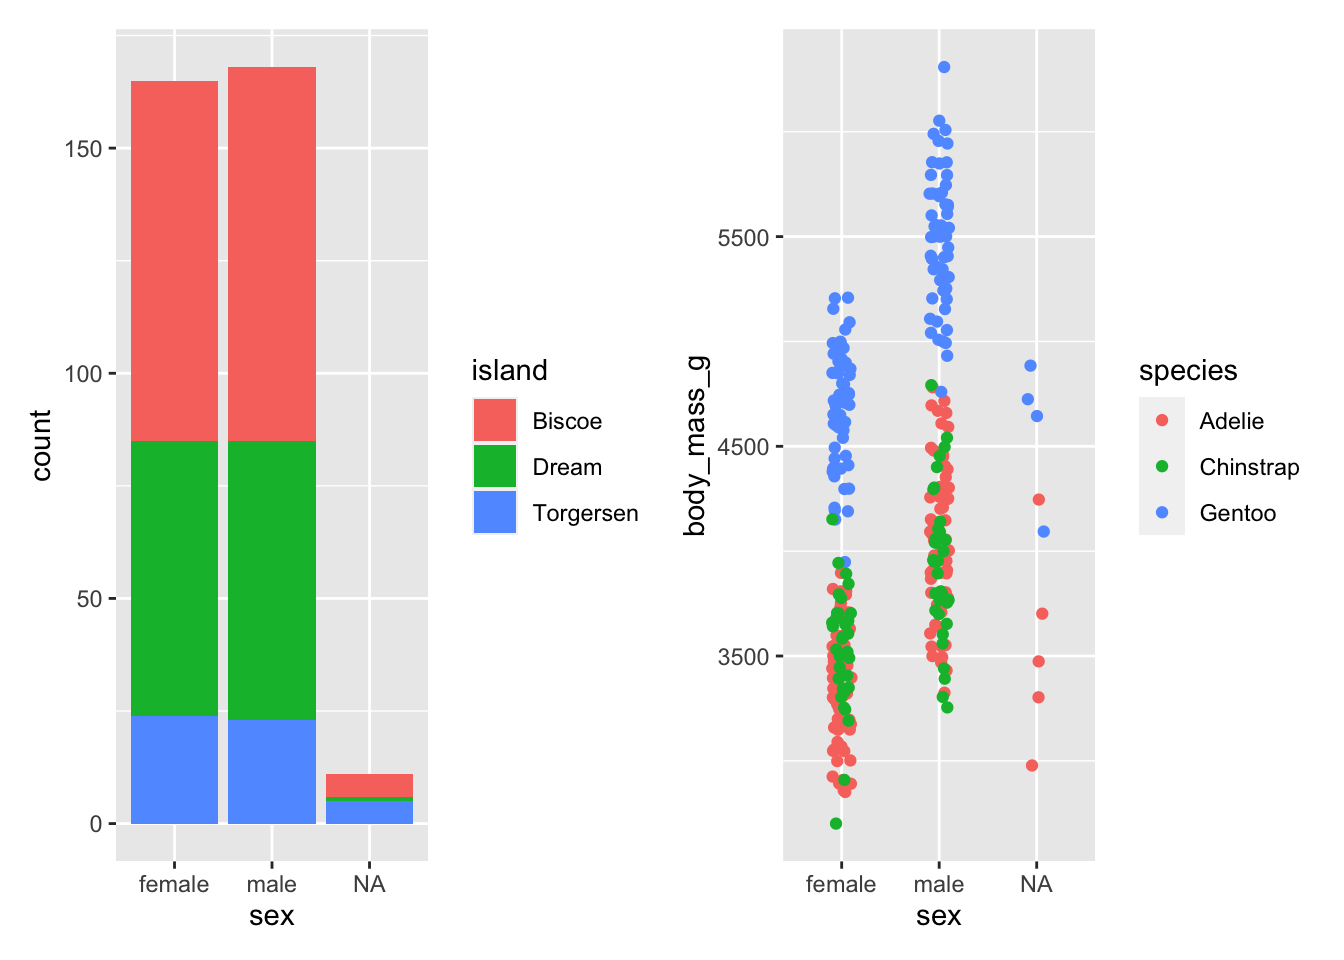
barGraph / dotPlot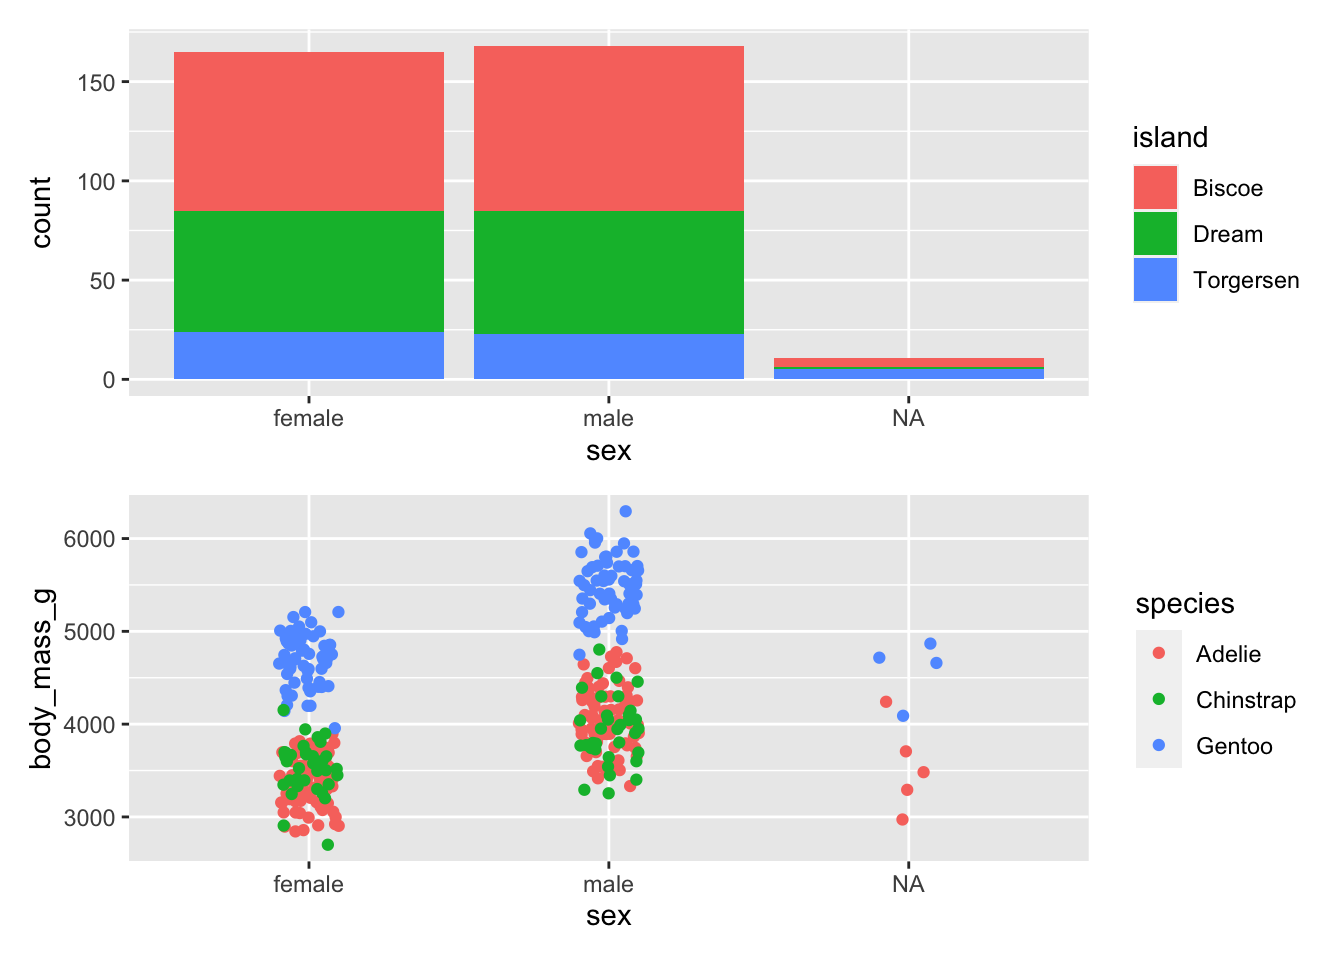
There are many ways in which patchwork can arrange plots. See the chapter Arranging Plots in ggplot2: Elegant Graphics for Data Analysis for more complex examples.