16.4 More than one geom
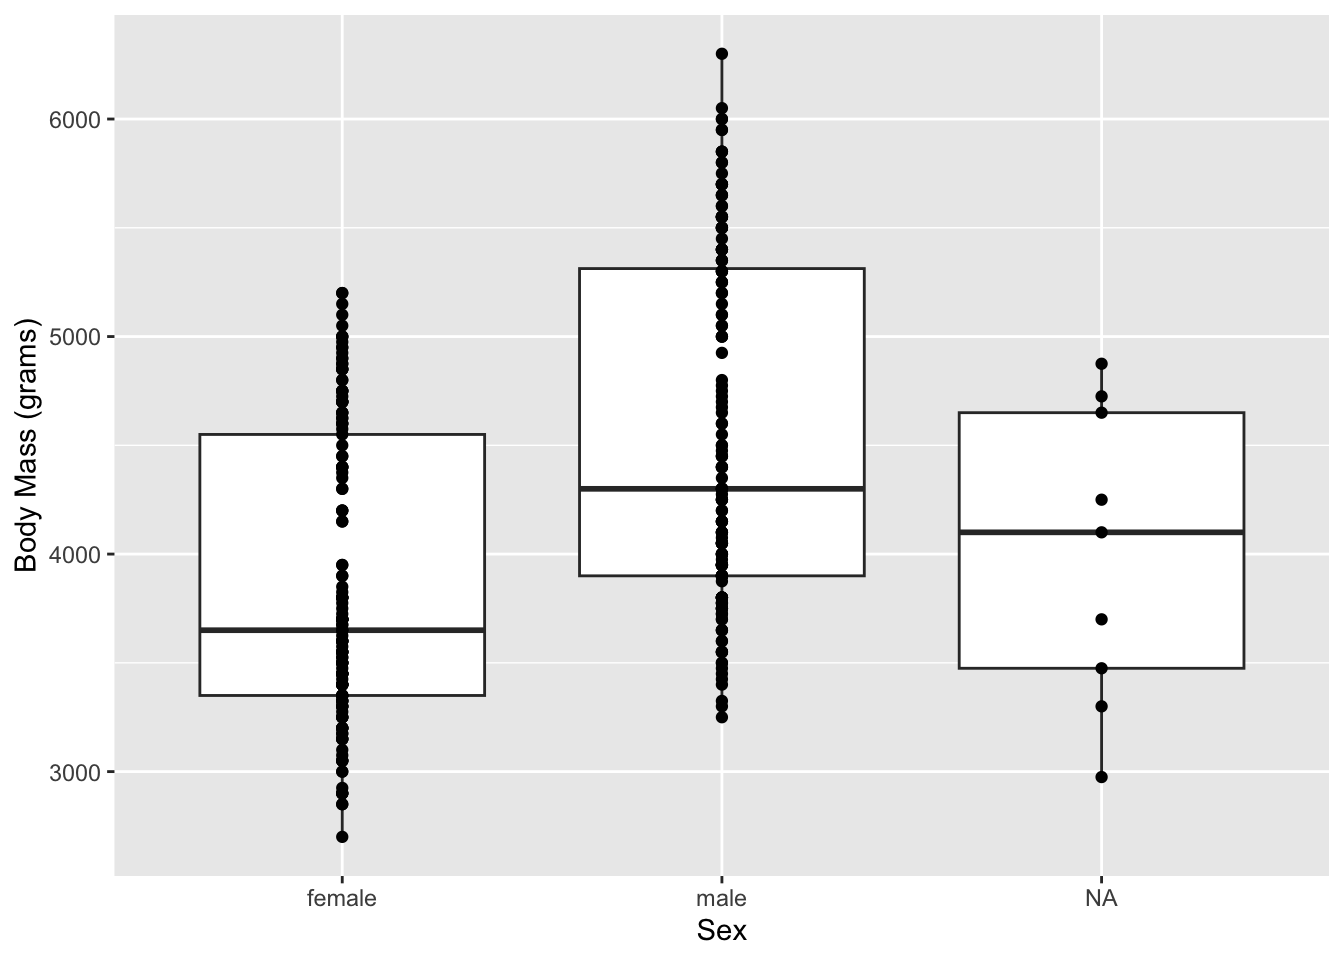
It can be handy occasionally to have more than one geom per plot, like including both lines and dots. To do this, we feed our data set and aesthetic mappings into ggplot(), and then call multiple geoms. Using the box plot example from earlier and adding individual data points:
ggplot(data = penguins, aes(x = sex, y = body_mass_g)) +
  geom_boxplot() +
  geom_point() +
  labs(
    x = "Sex",
    y = "Body Mass (grams)"
  )
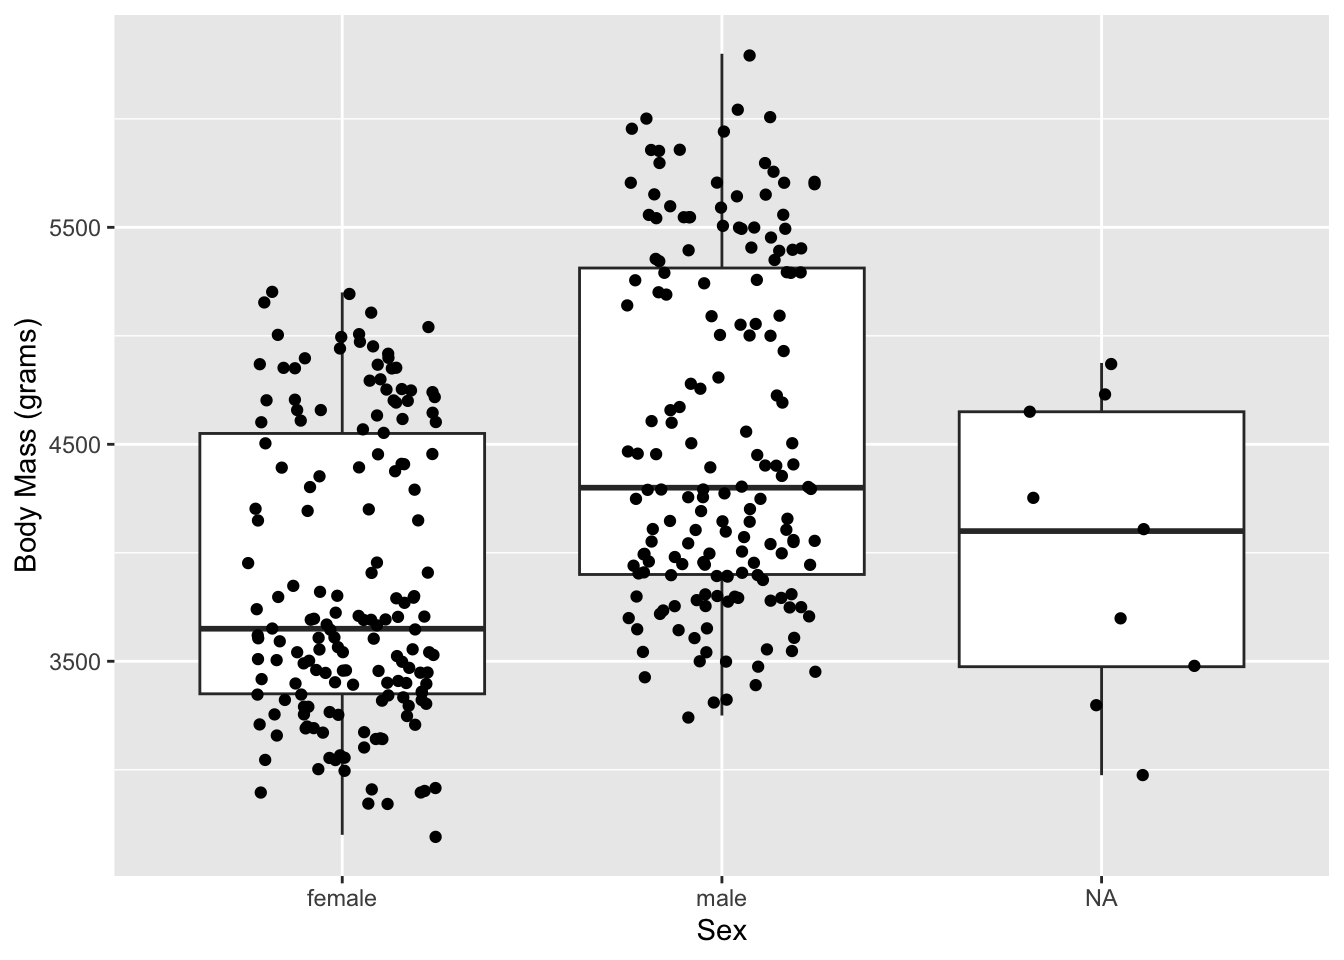
When there are a lot of data points, using ‘jitter’ to create lateral space between points can be useful.
ggplot(data = penguins, aes(x = sex, y = body_mass_g)) +
  geom_boxplot() +
  geom_jitter(width = 0.25) +
  labs(
    x = "Sex",
    y = "Body Mass (grams)"
  )
If you start typing geom_ you’ll see a full list of available plots to you with ggplot. If you’d like more in depth coverage of geoms built into ggplot, see the reference page section on geoms.