16.2 Labeling and captions
Labels default to our variable names, which may not be what we want on our graph. We can override this with labs().
ggplot(data = penguins, aes(x = sex, y = body_mass_g)) +
  geom_boxplot() +
  labs(
    x = "Sex",
    y = "Body Mass (grams)"
  )
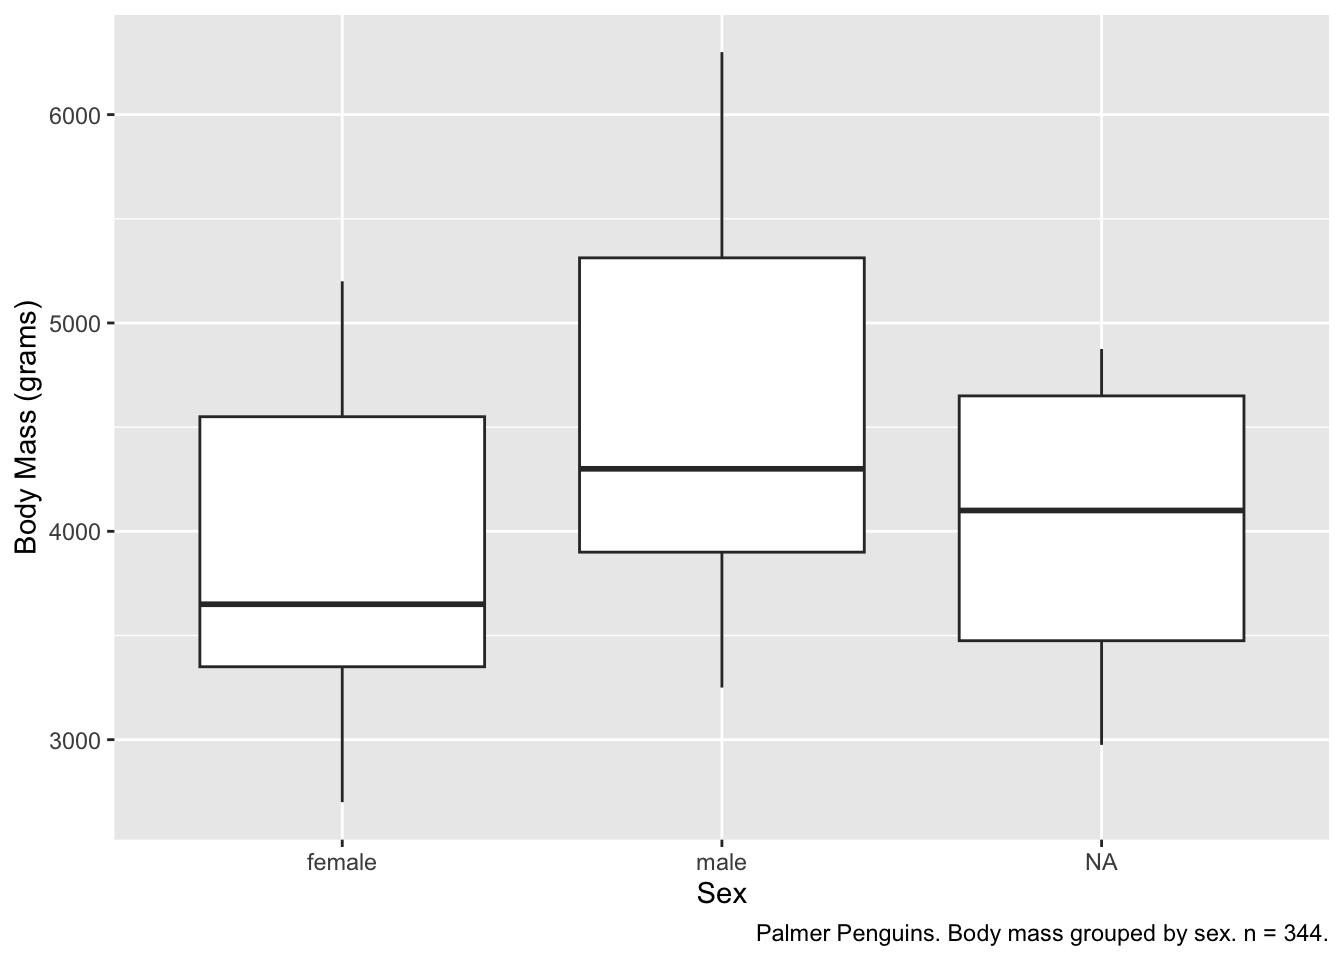
Captions are also important. There are two ways that we can add this information. The first uses labs():
ggplot(data = penguins, aes(x = sex, y = body_mass_g)) +
  geom_boxplot() +
  labs(
    x = "Sex",
    y = "Body Mass (grams)",
    caption = "Palmer Penguins. Body mass grouped by sex. n = 344."
  )
The second is better if we’re using RMarkdown. Note also that we can include markdown syntax, italicizing the n.
```{r, fig.cap = "Palmer Penguins. Body mass grouped by sex. *n* = 344."}
ggplot(data = penguins, aes(x = sex, y = body_mass_g)) +
  geom_boxplot(na.rm = TRUE) +
  labs(
    x = "Sex",
    y = "Body Mass (grams)"
  )
```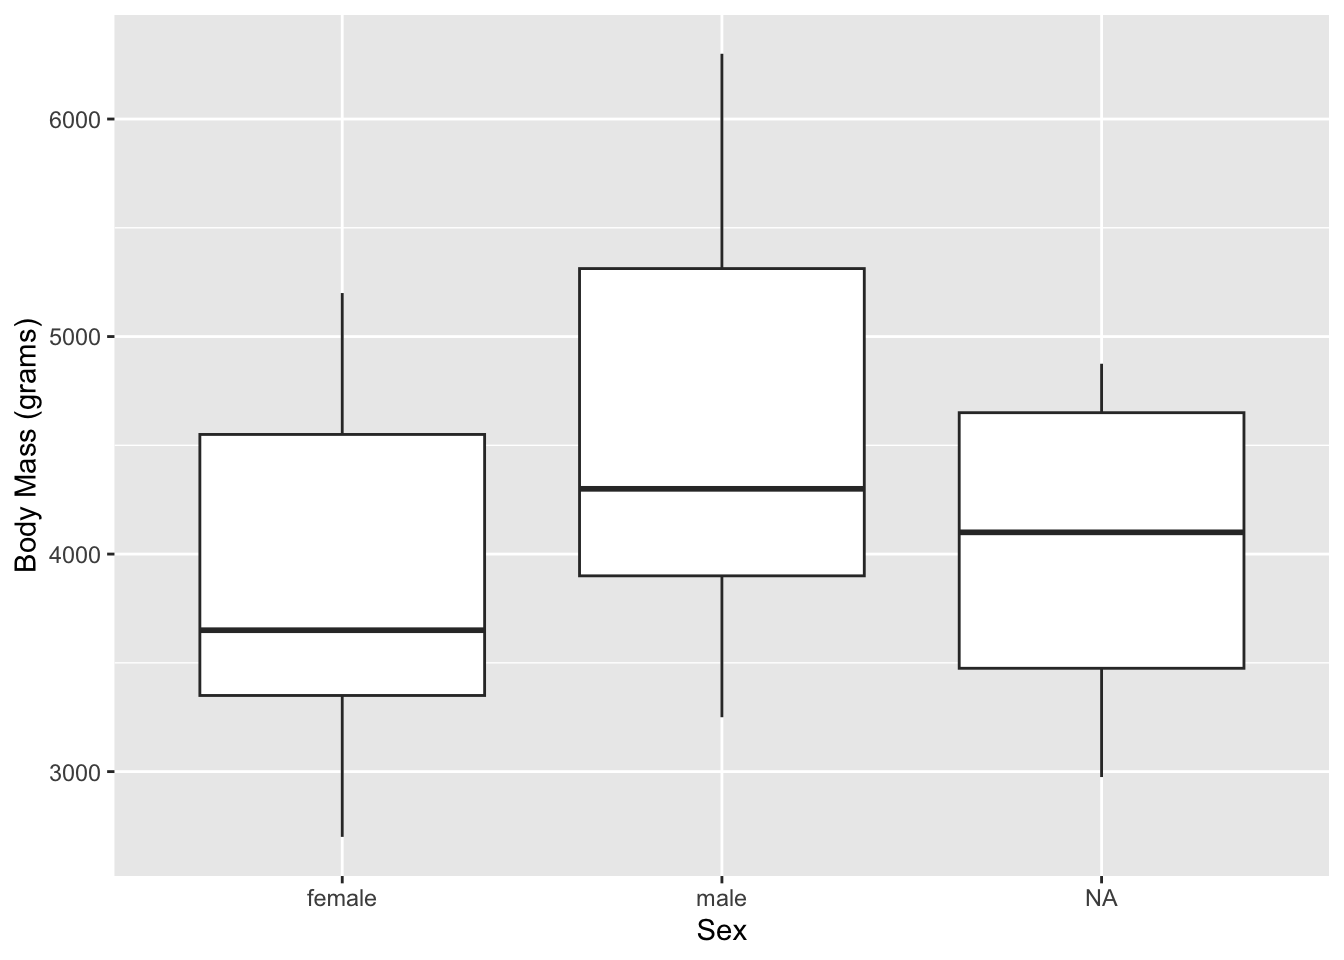
Figure 16.1: Palmer Penguins. Body mass grouped by sex. n = 344.
If you’re knitting your report to html instead of pdf and you want to take advantage of automatic figure numbering–knitting to pdf will take care of automatic figure numbering by default–use the output option bookdown::html_document2 in your YAML.
---
title: My Report
output: bookdown::html_document2
---