Data Organization
When we load our data into a program, that program is expecting our data to be organized in a particular way. The way that we should ideally organize our data is often referred to as Tidy Data.
Refer to the chapter Tidy Data in the Procedures and Guidelines document to help you get your data in order before continuing with the rest of the material here.
Missing data
If your data contain any missing values, make sure your have a standard way of filling those cells. Blank cells are not very useful - a blank cell tells us very little about why it's blank - Was this a mistake? Is it supposed to be empty? Who knows?
Instead, be purposeful. A standard filler or stand in for a missing piece of data is NA, standing for "not available". Your _README file or _DATA-DICTIONARY should indicate that missing data points are noted with NA. It’s important to note that NA isn’t simply the characters N and A. Rather, NA is a specific designation that indicates to your computer when there is no value available for that cell of your data. Different programs (R, SPSS, Excel) have different ways of representing or storing NA values. While at this stage you are not expected to know all of the different ways of specifying NA values in different programs, you will need to use a standardized method for indicating missing values in your data before uploading it to R.
To keep it simple for this course, simply type the characters NA into the cell of your spreadsheet to indicate missing data.
Once you've got your data organized in Excel - or whichever program your are using - according to the principles of Tidy Data and you've ensured that any missing data points are filled with NA, you're ready to save your file in a format for import into the Shiny App.
If we were to use the palmerpenguin data from Lab 7 as an example, following is what our data in Excel might look like:
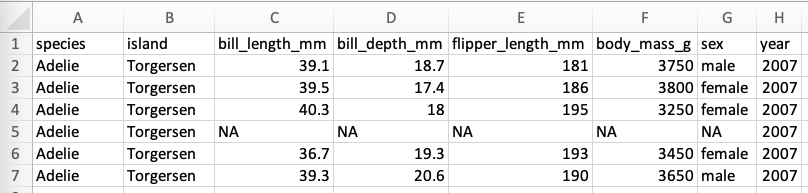
Penguins dataNote that we have a header row with values for each of the variables, including the species, island and various measurements taken. Since we have a header, when we import our data into the Shiny App, we'll want to make sure we're indicating that there's a header. We also have one row for each observation of an individual penguin.
Getting to Know Your Data
Not all data that you come across will include a header in the file. Sometimes the variables are described exclusively in the _Data-Dictionary that accompanies the data set. Nor will all data that you come across use the convention of NA, especially if that data has already been opened in - or saved from - another piece of statistical software.
Familiarizing yourself with your data is critically important, which is why _README and _Data-Dictionary files are so important. It's also important that we examine the data file itself - opening the csv or Excel file and having a look through. Doing so can help to avoid common errors such as misinterpreting empty cells, including variable values stored in a header as data itself and the like.