Fish Population Project
Fish population declines: Mitigation recommendations needed
Phytoplankton, microscopic single-celled algae, are natural components of aquatic ecosystems and are natural components of aquatic ecosystems and are responsible for half of the carbon and oxygen produced by plants in the world. Some phytoplankton species, however, produce toxins. These toxin producing algae are becoming more common and showing up in more places worldwide. Some of these toxins will produce neurotoxins that prevent nerve transmission signals, resulting in negative effects in animals that consume it. Toxins from phytoplankton can be transferred through the food web and accumulate in higher trophic levels, causing mortality in shellfish, fish, sea birds, and humans. Humans that eat contaminated shellfish can become sick and die. A major challenge for aquatic scientists and environmental managers is to predict the response of animal populations to the proliferation of toxic phytoplankton. A great deal of scientific effort is spent trying to understand the population dynamics of toxic algal blooms and their effects on the food web.
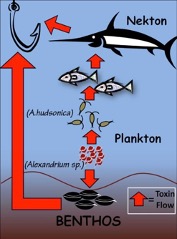
Figure 1. Simplified marine food web, including toxic phytoplankton
A vital link between phytoplankton and higher trophic levels is provided by copepods, a type of zooplankton. Zooplankton are animal-like plankton that need to ingest other organisms to survive. Copepods are estimated to be the most abundant animals on the planet and are the main food source for many larval fish species. This leads to the refrain: no copepods no fish.
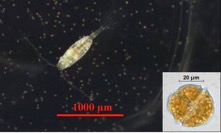
Figure 2. The copepod Acartia hudsonicaand a toxic phytoplankton cell, Alexandrium fundysense.
The toxic dinoflagellate genus Alexandrium spp. Often blooms from Long Island Sound in the United Sates, to the Bay of Fundy, Canada (Figure 3). This bloom results in negative effects in animals (grazers) that consume it and these toxins can accumulate in the higher trophic levels, causing mortality in fish, sea birds and humans. In order to better predict the response of animal populations to the proliferation of toxic phytoplankton, Alexandrium fundysense, scientist studied the populations of the copepod Acartia hudsonica found in two different regions of the distribution from the Bay of Fundy, Canada, to about Long Island sound, New York and Connecticut. There are frequent and high toxicity levels in the norther region of this range (e.g., Maine) and no toxic blooms recorded in the southern regions (e.g., New Jersey).
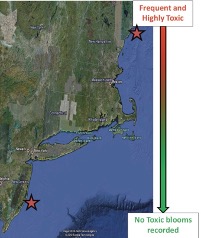
Figure 3. Geographical distribution of toxic Alexandrium spp. The frequency and toxicity of Alexandrium decreases from north to south. The copepod Acartia hudsonica, a main grazer of toxic Alexandrium, is found throughout the entire range shown. Stars correspond to population origins from experiments described here. Northern star indicates Maine, southern star indicates New Jersey sampling sites.
Scientist discovered that at maximum ingestion rates the Maine population had higher egg production compared to the New Jersey population (Figure 4) however when copepods were ingesting non-toxic phytoplankton there were no differences in egg production between these populations (Figure 5).
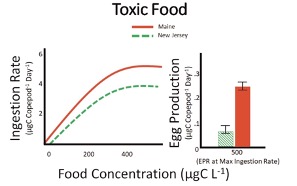
Figure 4. Ingestion rate (feeding; left) and egg production rate (reproduction; right) for copepods feeding on a diet containing toxic Alexandrium spp. Ingestion rates were measured over a range of food concentrations while egg production rates correspond to a single concentration. Food saturation occurs around 500 µgCL-1; this means that this concentration represents maximum ingestion and egg production. Scientist chose this concentration for egg production because this is where the greatest difference, if any, in ingestion rate occurred. The Maine population (red) had statistically higher ingestion and egg production rate compared to copepods from New Jersey (green). Units for the dependent variable are in micrograms of carbon (µgC; food) and per copepod per day (ingestion and egg production). Error bars represent standard deviation among replicates in egg production; they are omitted for clarity from ingestion rates. Data adapted from Colin and Dam (2007, 2004).
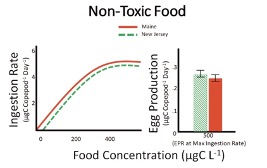
Figure 5. Ingestion rate (feeding; left) and egg production rate (reproduction; right) for copepods feeding on a n o-toxic diet. Ingestion rates were measured over a range of food concentrations while egg production rates correspond to a single concentration. Food saturation occurs around 500µgCL-1; this mean as that this concentration represents maximum ingestion and egg production. There were no differences between the Maine (red) and New Jersey (green) populations for both ingestion and egg production rate compared. That is, the two populations fed and reproduced at the same rate. Units and errors bars are the same as Figure 1. Data adapted from Colin and Dam (2007, 2004).
There is still much to learn about the fecundity, mortality and growth of copepods in response to toxic algae. Scientist need to better understand the interaction between toxic algae and their grazers and the adaptability of copepods to toxic algae. Understanding these relationships is key to being able to predict and mitigate issues surrounding fish populations.
Your Role
You have been hired by National Freshwater Copepod Conservation and Fish Restoration agency (NFCCFR) to investigate the impacts of toxic algae on copepod populations. The NFCCFR is interested to know what negative effects, if any, can toxic algae produce in the copepod population in freshwater populations.
Due to budget constraints you and your partner will need to conduct this research in lab and provide the NFCCFR with a proposal for approval prior to initiating your research. (The NFCCFR is your TA in case you were wondering). Before you can begin developing your proposal you must first become immersed in your topic. You and your partner will need to source out 5 primary source papers related to this topic.